How to Track Progressive Overload in Google Sheets (Step-by-Step)
Track progressive overload in Google Sheets with volume load formulas, rolling averages, and auto deload signals. See the full breakdown.

From Sort & Keep, the maker of the linked templates. Our current product prices update with your selected currency. Worked examples and third-party prices keep their stated currency and date.
A workout log records sets, reps and weights. Reviewing those entries across sessions helps you see changes in the work you have done. Keep notes on your programme and how sessions felt alongside the numbers.
If you want to track progressive overload properly, you need to calculate volume load, compare it week over week, smooth out noise with rolling averages, and flag when progress stalls. Google Sheets can do all of this for free. Here is exactly how to set it up.
What Progressive Overload Actually Means
Most lifters think progressive overload means "add weight to the bar." That is one form of it, and it stops working reliably after your first 6-12 months of training.
Progressive overload means increasing total training stimulus over time. The best single proxy for training stimulus is volume load:
Volume Load = Sets x Reps x Weight
If you bench pressed 3 sets of 8 reps at 80kg last week, your volume load was 1,920kg. This week you did 3 sets of 9 reps at 80kg. Your volume load is 2,160kg. That is a 12.5% increase in training stimulus, even though the weight on the bar did not change.
This is why tracking sets and reps alone is misleading. "I did 3x8 at 80kg last week and 4x6 at 85kg this week". Did you progress? Volume load answers immediately: 1,920kg vs 2,040kg. Yes, a 6.3% increase. Without the calculation, you are guessing.
Volume load records one aspect of training work. It does not account for proximity to failure or rest periods, so keep it alongside your other training notes.
Step 1: Build the Exercise Log
Create a new Google Sheet. Name the first tab "Workout Log." Set up these columns starting from row 1:
| A | B | C | D | E | F | G |
|---|---|---|---|---|---|---|
| Date | Exercise | Set | Reps | Weight | RPE | Volume Load |
Starting from row 2, you will enter one row per set. So a session where you do 3 sets of bench press and 3 sets of rows produces 6 rows:
2026-03-10  Bench Press   1   8   80   7   640
2026-03-10  Bench Press   2   8   80   8   640
2026-03-10  Bench Press   3   7   80   8   560
2026-03-10  Barbell Row   1   8   70   7   560
2026-03-10  Barbell Row   2   8   70   7   560
2026-03-10  Barbell Row   3   7   70   8   490
The Volume Load column (G) uses this formula in G2:
=D2*E2
That is it. Reps times weight. Copy it down for every row. Some lifters multiply by sets as well, but since each row is a single set, the per-set calculation is cleaner. You will aggregate to weekly totals in a separate tab.
The RPE column (F) is Rate of Perceived Exertion on a 1-10 scale. RPE 7 means about 3 reps left in the tank, RPE 9 means 1 rep left. Optional now, but critical for fatigue detection later. Format the Date column as dates (Format > Number > Date). We will use date-based lookups to pull weekly totals.
Step 2: Calculate Weekly Volume Totals
Create a second tab called "Weekly Volume." This is where progressive overload becomes visible.
Set up the structure:
| A | B | C |
|---|---|---|
| Week Starting | Exercise | Weekly Volume Load |
In column A, enter the Monday date of each training week (2026-03-03, 2026-03-10, 2026-03-17, etc.). In column B, enter each exercise you want to track.
The Weekly Volume Load formula in C2 uses SUMPRODUCT to pull data from the Workout Log tab:
=SUMPRODUCT(
  ('Workout Log'!A:A >= A2) *
  ('Workout Log'!A:A < A2+7) *
  ('Workout Log'!B:B = B2) *
  'Workout Log'!G:G
)
This sums all volume load entries from the Workout Log where the date falls within that week and the exercise matches. It gives you one number: total volume load for that exercise in that week.
For total session volume across all exercises, use a simpler version without the exercise filter:
=SUMPRODUCT(
  ('Workout Log'!A:A >= A2) *
  ('Workout Log'!A:A < A2+7) *
  'Workout Log'!G:G
)
Step 3: Track Week-Over-Week Change
Add a column D to the Weekly Volume tab: "% Change."
In D3 (you need at least two weeks of data):
=IF(C2>0, (C3-C2)/C2, "")
Format the column as percentage. Now you can see at a glance: +8.3% means you increased training stimulus. -5.1% means you did less. 0% means maintenance.
Apply conditional formatting to make this instantly readable:
- Select the % Change column
- Format > Conditional formatting
- Rule 1: "Greater than 0". Green background
- Rule 2: "Less than 0". Red background
- Rule 3: "Equal to 0". Yellow background
Green means progressive overload happened. Red means regression. Yellow means maintenance. When you open this tab, your training story is visible in two seconds without reading a single number.
Step 4: Add a 4-Week Rolling Average
Week-to-week volume fluctuates. You might have a bad sleep night, a short session due to schedule, or an extra-motivated day where you threw in two additional sets. Single-week comparisons are noisy. The 4-week rolling average smooths this out and reveals the actual trend.
Add column E to the Weekly Volume tab: "4-Week Avg."
In E5 (once you have 4 weeks of data):
=AVERAGE(C2:C5)
Copy down. Each cell averages the current week and the three preceding weeks.
Then add column F: "Avg Trend". The week-over-week change in the rolling average:
=IF(E5>0, (E6-E5)/E5, "")
Apply the same conditional formatting (green/red/yellow). This trend line is what you actually care about. If the 4-week average is climbing, you are progressively overloading. If it is flat or declining, something needs to change.
The 4 Types of Progressive Overload (and How to Track Each)
Adding weight is the most obvious form of progressive overload, but it is not the only one. There are four distinct ways to increase training stimulus, and your spreadsheet should track all of them.
1. Load Progression (More Weight)
The classic: same sets and reps, heavier weight. If you squatted 3x5 at 100kg last week and 3x5 at 102.5kg this week, that is load progression.
How to track it: Your Volume Load column captures this automatically. 3x5x100 = 1,500. 3x5x102.5 = 1,537.5. The weekly volume total and % change reflect the increase.
This works well for beginners and early intermediates. It becomes unreliable after 1-2 years because you cannot add 2.5kg every week forever.
2. Volume Progression (More Sets or Reps)
Same weight, more total work. This can mean adding a rep to each set (3x8 becomes 3x9), adding an entire set (3x8 becomes 4x8), or both.
How to track it: Again, volume load handles this. 3x8x80 = 1,920. 3x9x80 = 2,160. 4x8x80 = 2,560. The math does not care whether the increase came from reps or sets.
This is the primary driver of hypertrophy for intermediate lifters. Most people respond best to 10-20 sets per muscle group per week, and volume progression is how you ramp up within that range.
3. Density Progression (Same Work, Less Time)
Same volume load completed in less time. This improves work capacity and cardiovascular fitness alongside strength.
How to track it: Add a "Session Duration" column to your Workout Log (in minutes). Then create a "Density" calculation in the Weekly Volume tab:
=C2/[Total Session Minutes for that week]
Volume load per minute. If it increases, you are getting fitter even when the raw volume stays flat. This is an underrated metric that most trackers ignore entirely.
4. Frequency Progression (More Sessions)
Training a muscle group 3 times per week instead of 2, while maintaining per-session volume, increases weekly stimulus by 50%.
How to track it: The weekly volume total captures this automatically. More sessions with the same per-session volume means higher weekly totals. If you want an explicit session count, add a COUNTIFS column that counts unique dates per exercise per week.
When to Deload: Auto-Detecting Fatigue
A deload is a planned reduction in volume and intensity (typically 40-50% for one week) that lets accumulated fatigue dissipate. Most lifters either never deload and grind themselves into the ground, or deload on a fixed schedule whether they need it or not.
Your spreadsheet can tell you when to deload based on actual performance data.
The 10% Rule
If your weekly volume load for a given exercise drops by 10% or more for two consecutive weeks. Despite similar effort (RPE staying the same or increasing). That is a fatigue signal. Your body is telling you it cannot recover from the current workload.
Add a "Deload Signal" column to the Weekly Volume tab. In G3:
=IF(AND(D2<-0.1, D3<-0.1), "DELOAD", "")
This checks whether the % change was below -10% for both the current week and the previous week. If both are true, it prints "DELOAD" in red.
RPE Creep
A subtler fatigue signal: the same weight at the same reps starts feeling harder. If your bench press at 80kg for 8 reps was RPE 7 three weeks ago and is now RPE 9, you are accumulating fatigue even if the raw numbers look fine.
Track average RPE per exercise per week in the Weekly Volume tab:
=AVERAGEIFS(
  'Workout Log'!F:F,
  'Workout Log'!A:A, ">=" & A2,
  'Workout Log'!A:A, "<" & A2+7,
  'Workout Log'!B:B, B2
)
If average RPE for an exercise increases by 1+ point over 3 consecutive weeks while volume load stays flat or drops, schedule a deload. Your nervous system is fatiguing faster than the muscles.
Mistakes That Stop You Tracking Progressive Overload
Expecting Linear Progression Past the Novice Stage
Adding 2.5kg to every lift every week works for 3-6 months. After that, progress is nonlinear. You might gain 5% volume load in one week, stay flat for two weeks, then jump another 3%. The 4-week rolling average handles this. But only if you do not panic during flat weeks and abandon your program.
Not Tracking RPE or RIR
Volume load alone cannot distinguish between productive training and junk volume. Five sets of squats at RPE 6 is a very different stimulus than five sets at RPE 9, even with identical volume load. Log RPE for at least your main compound lifts. It takes 2 seconds per set and makes your data dramatically more useful.
Changing Exercises Too Often
You cannot track progressive overload on an exercise you have only done twice. If you rotate from barbell bench to dumbbell bench to machine press to floor press every two weeks, you have no trend data for any of them.
Pick your main exercises and stick with them for at least 6-8 weeks. Track accessories more loosely. The exercises you measure are the exercises you can progressively overload.
Over-Engineering the Spreadsheet
If building the tracking system takes longer than actually training, you have missed the point. Start with the basics: exercise, sets, reps, weight, volume load, weekly totals, % change. Add rolling averages and RPE tracking once the habit is established. The best tracking system is the one you actually use consistently.
Skip the Setup: Use a Pre-Built Tracker
Everything above works. It is also 2-3 hours of spreadsheet setup, formula debugging, and conditional formatting before you log your first set. And it still will not have exercise categorization by muscle group, estimated 1RM calculations, periodization planning, or per-muscle-group volume aggregation.
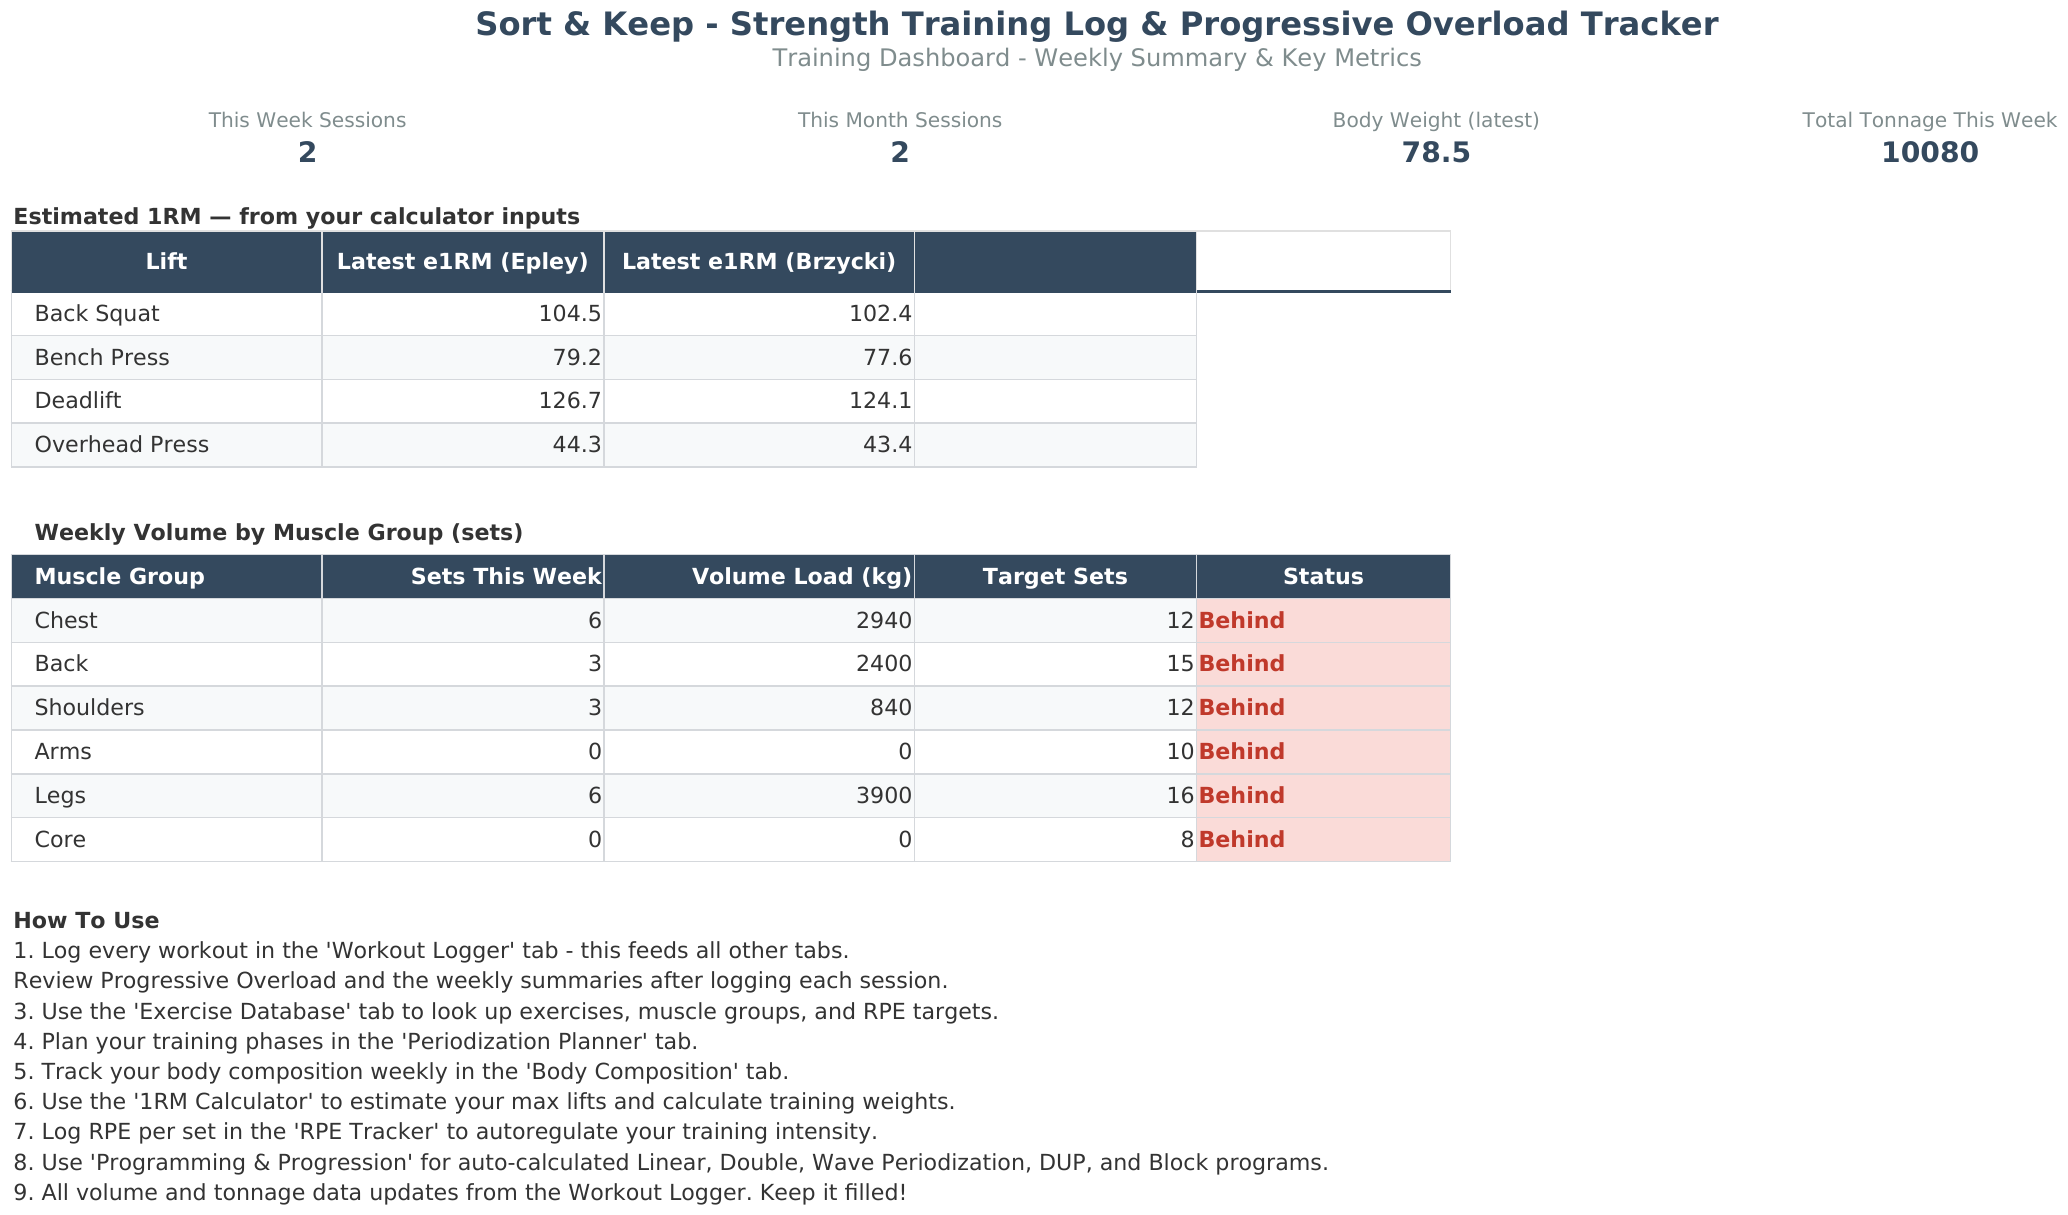
We built the Strength Training Log & Progressive Overload Tracker (Sort & Keep) specifically because we went through this exact process ourselves and realized most lifters should not have to.
UK edition tracks in kg with press-ups, personal bests, and metric defaults. US edition tracks in lbs with push-ups and personal records. Same progressive overload science. Your preferred units.
It includes everything in this guide. Volume load tracking, weekly comparisons with conditional formatting, 4-week rolling averages, RPE tracking, and deload signaling. Plus features that are genuinely painful to build from scratch in a blank sheet:
- 150+ exercises pre-categorized by muscle group and movement pattern
- Automatic per-muscle-group volume aggregation (bench press counts toward chest, triceps, and front delts)
- Estimated 1RM calculations using both Epley and Brzycki formulas
- Periodization planner with phase-appropriate volume targets
- Mobile-optimized logging layout designed for speed between sets
$6.75 one-time. Google Sheets and Excel compatible. Saves you the entire setup process described above.
Get the Strength Training Log on Sort & Keep | Also on Sort & Keep; $6.75
If you would rather build it yourself, everything you need is in this article. Either way, the point is the same: stop logging workouts and start tracking progressive overload. They are not the same thing, and the difference is what separates lifters who plateau from lifters who keep growing.
Related Reads
- Strength Training Log & Progressive Overload Tracker: Full Feature Breakdown
- Best 5/3/1 Spreadsheet Template: Free and Paid Options Compared
- Best Workout Log Spreadsheets for Progressive Overload (2026)
Get free spreadsheet templates and updates. New templates, feature updates, and practical guides delivered to your inbox. No spam, unsubscribe anytime.
Subscribe free → | Already have a template? Download the free budget tracker or free meal planner. Email required for delivery; newsletter optional.
Choose the right next step
The Strength Training Log is a progressive-overload tracker spreadsheet and workout log for Google Sheets or Excel, built for recording the work and deciding what to increase next.