FIRE Spreadsheet: Calculate Your Financial Independence Number
FIRE spreadsheet to calculate your FI number, savings rate, and years to financial independence in Google Sheets. Get the template.

From Sort & Keep, the maker of the linked templates. Our current product prices update with your selected currency. Worked examples and third-party prices keep their stated currency and date.
The FIRE movement (Financial Independence, Retire Early) has one of the most passionate communities in personal finance. But here's the thing: most people who talk about FIRE don't actually know their number. A FIRE spreadsheet turns vague ambition into a concrete, trackable plan.
It's not "save a million pounds." Your FI number is based on a simple formula: annual expenses x 25. That's the 4% rule. Withdraw 4% of your portfolio each year, and historically it lasts 30+ years.
A £30,000/year lifestyle needs £750,000. A £50,000/year lifestyle needs £1.25 million. A frugal £20,000/year lifestyle? Just £500,000.
The spreadsheet we're building below calculates all of this automatically. Your FI number, savings rate, projected timeline, and what-if scenarios that show exactly how each decision moves your retirement date.
The Core FIRE Calculations
Before we build anything, here are the five numbers every FIRE spreadsheet needs to track.
FI Number. How much you need invested so your portfolio covers expenses indefinitely. Annual Expenses x 25. Spend £36,000/year? Your FI number is £900,000. Every pound you cut from annual spending reduces your target by £25.
Savings Rate. The percentage of take-home pay you save and invest. (Income - Expenses) / Income x 100. Someone earning £3,500/month and spending £2,200/month has a 37% savings rate. This matters more than investment returns.
Years to FI. How long until your investments hit your FI number. Depends on current savings, monthly contributions, and return rate. Rough guidance: a 50% savings rate gets you to FI in roughly 17 years. A 65% rate? About 10.
Coast FIRE Number. The amount you need invested now so compound growth alone carries it to your FI number by traditional retirement age, even if you never save another penny. A 30-year-old with a £900,000 target needs roughly £118,000 at 7% returns to coast to FI by 60.
Barista FIRE Number. Partial FI. Your investments cover essential expenses only. Essential Expenses x 25. If bare essentials cost £18,000/year, your Barista FIRE number is £450,000.
Building Your FIRE Spreadsheet in Google Sheets
Here's how to build the whole thing from scratch. Takes about 20 minutes.
Step 1: Set Up Your Income and Expenses
Create a new Google Sheet. Name the first tab "FIRE Calculator" and enter your financial baseline.
| A | B | |
|---|---|---|
| 1 | FIRE CALCULATOR | |
| 3 | Monthly Take-Home Income | 3,500 |
| 4 | Monthly Expenses | 2,200 |
| 5 | Monthly Savings | =B3-B4 |
| 7 | Annual Income | =B3*12 |
| 8 | Annual Expenses | =B4*12 |
| 9 | Annual Savings | =B5*12 |
Be honest with the expenses number. Use your actual spending from the last 3-6 months, not what you wish you spent. If you're not sure, our Free Budget Tracker | Also on Sort & Keep will give you a clear picture within one month.
Step 2: Calculate Your Key FIRE Numbers
Below the basics, add the core calculations.
| A | B | |
|---|---|---|
| 11 | FIRE NUMBERS | |
| 12 | Savings Rate | =B5/B3 |
| 13 | FI Number (4% rule) | =B8*25 |
| 14 | Current Investments | 45,000 |
| 15 | Gap to FI | =B13-B14 |
| 17 | ASSUMPTIONS | |
| 18 | Expected Annual Return | 7% |
| 19 | Inflation Rate | 2.5% |
| 20 | Real Return (after inflation) | =B18-B19 |
| 21 | Traditional Retirement Age | 60 |
| 22 | Current Age | 32 |
The 7% return assumption is roughly what global index funds have averaged historically. We use the real return (4.5%) for projections so everything stays in today's pounds.
Step 3: Calculate Your Timeline
Now the exciting part. When do you actually hit FI?
| A | B | |
|---|---|---|
| 24 | TIMELINE | |
| 25 | Years to FI | =NPER(B20/12, -B5, -B14, B13)/12 |
| 26 | FI Target Date | =EDATE(TODAY(), B25*12) |
| 27 | FI Age | =B22+B25 |
| 29 | COAST FIRE | |
| 30 | Years to Traditional Retirement | =B21-B22 |
| 31 | Coast FIRE Number | =B13/(1+B20)^B30 |
| 32 | Reached Coast FIRE? | =IF(B14>=B31, "YES", "NO") |
| 34 | BARISTA FIRE | |
| 35 | Monthly Essential Expenses | 1,500 |
| 36 | Barista FIRE Number | =B351225 |
| 37 | Reached Barista FIRE? | =IF(B14>=B36, "YES", "NO") |
The NPER function does the heavy lifting. It calculates how many months of contributions at a given return rate are needed to grow from your current investments to your FI number.
For the example numbers: £45,000 invested, saving £1,300/month, 4.5% real return, targeting £660,000. That's roughly 19 years. FI at age 51.
Step 4: Build the What-If Scenario Table
This is where a FIRE spreadsheet becomes genuinely powerful.
| D | E | F | G | |
|---|---|---|---|---|
| 1 | WHAT-IF SCENARIOS | FI Number | Years to FI | FI Age |
| 2 | Base case | =B13 | =B25 | =B27 |
| 3 | Cut expenses 10% | =B80.925 | =NPER(B20/12, -(B3-B40.9), -B14, B80.9*25)/12 | =B22+G3 |
| 4 | Cut expenses 20% | =B80.825 | =NPER(B20/12, -(B3-B40.8), -B14, B80.8*25)/12 | =B22+G4 |
| 5 | Returns at 5% gross | =B13 | =NPER(0.025/12, -B5, -B14, B13)/12 | =B22+G5 |
| 6 | Returns at 9% gross | =B13 | =NPER(0.065/12, -B5, -B14, B13)/12 | =B22+G6 |
| 7 | Extra £300/month saved | =B13 | =NPER(B20/12, -(B5+300), -B14, B13)/12 | =B22+G7 |
The what-if table reveals something that surprises most people: cutting expenses has a double effect. It lowers your FI number AND increases your savings rate. Adding £300/month to savings moves your FI date. Cutting £300/month from expenses moves it even more.
Step 5: Add a Compound Growth Projection
Create a second tab called "Projection" with a year-by-year breakdown.
| A | B | C | D | E | |
|---|---|---|---|---|---|
| 1 | Year | Age | Start Balance | Contributions | End Balance |
| 2 | 1 | =FIRE Calculator!B22 | =FIRE Calculator!B14 | =FIRE Calculator!B9 | =C2*(1+FIRE Calculator!B20)+D2 |
| 3 | 2 | =B2+1 | =E2 | =D2 | =C3*(1+FIRE Calculator!B20)+D3 |
Drag the formulas down 30-40 rows. Add a column F for your FI number target (a flat line), then chart columns A, E, and F as a line chart. The intersection is your FI date. Watching that compound growth curve cross the target line is one of the most motivating visuals in personal finance.
The FIRE Variants Explained
Not everyone is aiming for the same finish line.
Lean FIRE. Annual expenses under £25,000. FI number: £625,000 or less. Stripped-back lifestyle, achievable on a median UK income. The risk: very little margin for unexpected costs.
Fat FIRE. Annual expenses of £60,000+. FI number: £1.5 million or more. Financial independence without giving up nice holidays or a comfortable home. Most Fat FIRE pursuers are high earners (£80k+) who optimise savings rate rather than slashing expenses.
Coast FIRE. You've saved enough that compound growth alone hits your FI number by traditional retirement age. You still earn to cover current expenses, but you no longer need to save. Psychologically powerful. A 32-year-old who hits Coast FIRE can switch to a lower-stress job knowing retirement is mathematically sorted.
Barista FIRE. Your portfolio covers essentials, you work part-time for everything else. Named after the idea of working at a coffee shop for enjoyment and a small income. Your spreadsheet tracks essential expenses separately to calculate this number.
FIRE Spreadsheet Approaches: What's Already Out There
1. R/financialindependence Community Spreadsheets
Platform: Google Sheets | Price: Free
The subreddit has several community-built spreadsheets in their sidebar and wiki. The best ones include FI number, savings rate, projection charts, and milestone tracking. Battle-tested by thousands of users.
Pros: Free, built by actual FIRE pursuers, multiple variants including UK-specific.
Cons: Can be overwhelming (10+ tabs), documentation scattered across Reddit threads, some use US tax assumptions.
Verdict: Best free pre-built option. Search the subreddit for "spreadsheet" sorted by top/all-time.
2. ProjectionLab
Platform: Web app | Price: Free (basic) / $84/year or $249 lifetime (Pro)
A visual financial planning tool for exploring scenarios such as career changes and property purchases. Results depend on the assumptions you enter.
Pros: Beautiful scenario modelling, handles ISA/pension/SIPP properly, Monte Carlo simulations.
Cons: $84/year is significant, free tier is limited, less customisable than a spreadsheet.
Verdict: Best for visual FIRE planning. Worth the lifetime price if you're serious about scenario modelling.
3. CFIREsim (Crowdsourced FIRE Simulator)
Platform: Web app | Price: Free
A simulator that stress-tests your FIRE plan against every historical market period since 1871. Input your portfolio, withdrawal rate, and timeline. It returns your probability of success.
Pros: Free, uses actual historical data, shows success probability (e.g., "94% chance your money lasts 40 years").
Cons: Simulation only (not a tracker), US market data, doesn't help with accumulation phase.
Verdict: Essential for validating your plan. The spreadsheet tracks progress; cFIREsim stress-tests whether your end number actually works.
4. Paid FIRE Templates (Etsy / Gumroad)
Platform: Google Sheets / Excel | Price: £5 - £25
Dozens of paid templates available. Quality varies wildly. The better ones include FI number, Coast FIRE, projections, and scenario modelling in a polished package.
Pros: Pre-built, usually well-designed, saves 2-3 hours of building.
Cons: Inconsistent quality, some are just basic formulas with pretty formatting, no ongoing updates.
Verdict: Fine if you value your time over £10-15. Look for templates with what-if scenario tables. That's where the real value lives.
5. DIY Build (What We Walked Through Above)
Platform: Google Sheets | Price: Free | Time: 20-30 minutes
Pros: Free, you understand every calculation, fully customisable, no one else's assumptions baked in.
Cons: Takes time, possible formula errors if you're not spreadsheet-confident, no dashboard unless you build one.
Verdict: Best option if you're comfortable with Google Sheets and want a tool you fully understand.
Common FIRE Spreadsheet Mistakes
Using gross income instead of net. Your savings rate should use take-home pay. Someone earning £50,000 gross takes home roughly £38,500 after tax and NI. Gross income inflates your savings rate and makes your timeline look shorter than it is.
Ignoring inflation. If your spreadsheet uses 7% nominal returns, £900,000 in 20 years buys less than £900,000 today. Always use real returns (nominal minus inflation. Roughly 4-5%) or your FI number is a moving target.
Assuming constant returns. Markets don't return 7% every year. Sequence-of-returns risk means a crash in your first few years of retirement is far more damaging than one in year 15. At minimum, include a conservative scenario (5% returns) alongside your base case.
Not accounting for pension access gaps. If you retire at 45, you won't access your workplace pension until 55 (57 from 2028). Your ISA and GIA need to bridge that gap. Also: you need 35 qualifying years for the full State Pension (currently £11,502/year). Early retirement might create NI gaps.
Forgetting tax on withdrawals. ISA withdrawals are tax-free, but GIA withdrawals face Capital Gains Tax above the £3,000 annual allowance. Pension drawdowns above the personal allowance are taxed as income. Your withdrawal strategy matters as much as your accumulation strategy.
Tracking net worth instead of investable assets. Your home equity doesn't generate withdrawal income. A £500,000 net worth with £300,000 in home equity means only £200,000 counts toward your FI number.
Final Recommendation
The FIRE spreadsheet you build yourself is the one you'll trust and maintain. The calculations aren't complicated. Multiplication, compound interest, and a few what-if tables. Twenty minutes of setup saves you from years of guessing.
Start with two numbers: your monthly expenses (real, not aspirational) and your current invested assets. From there, the maths reveals everything. Your FI number, your timeline, the exact impact of every financial decision.
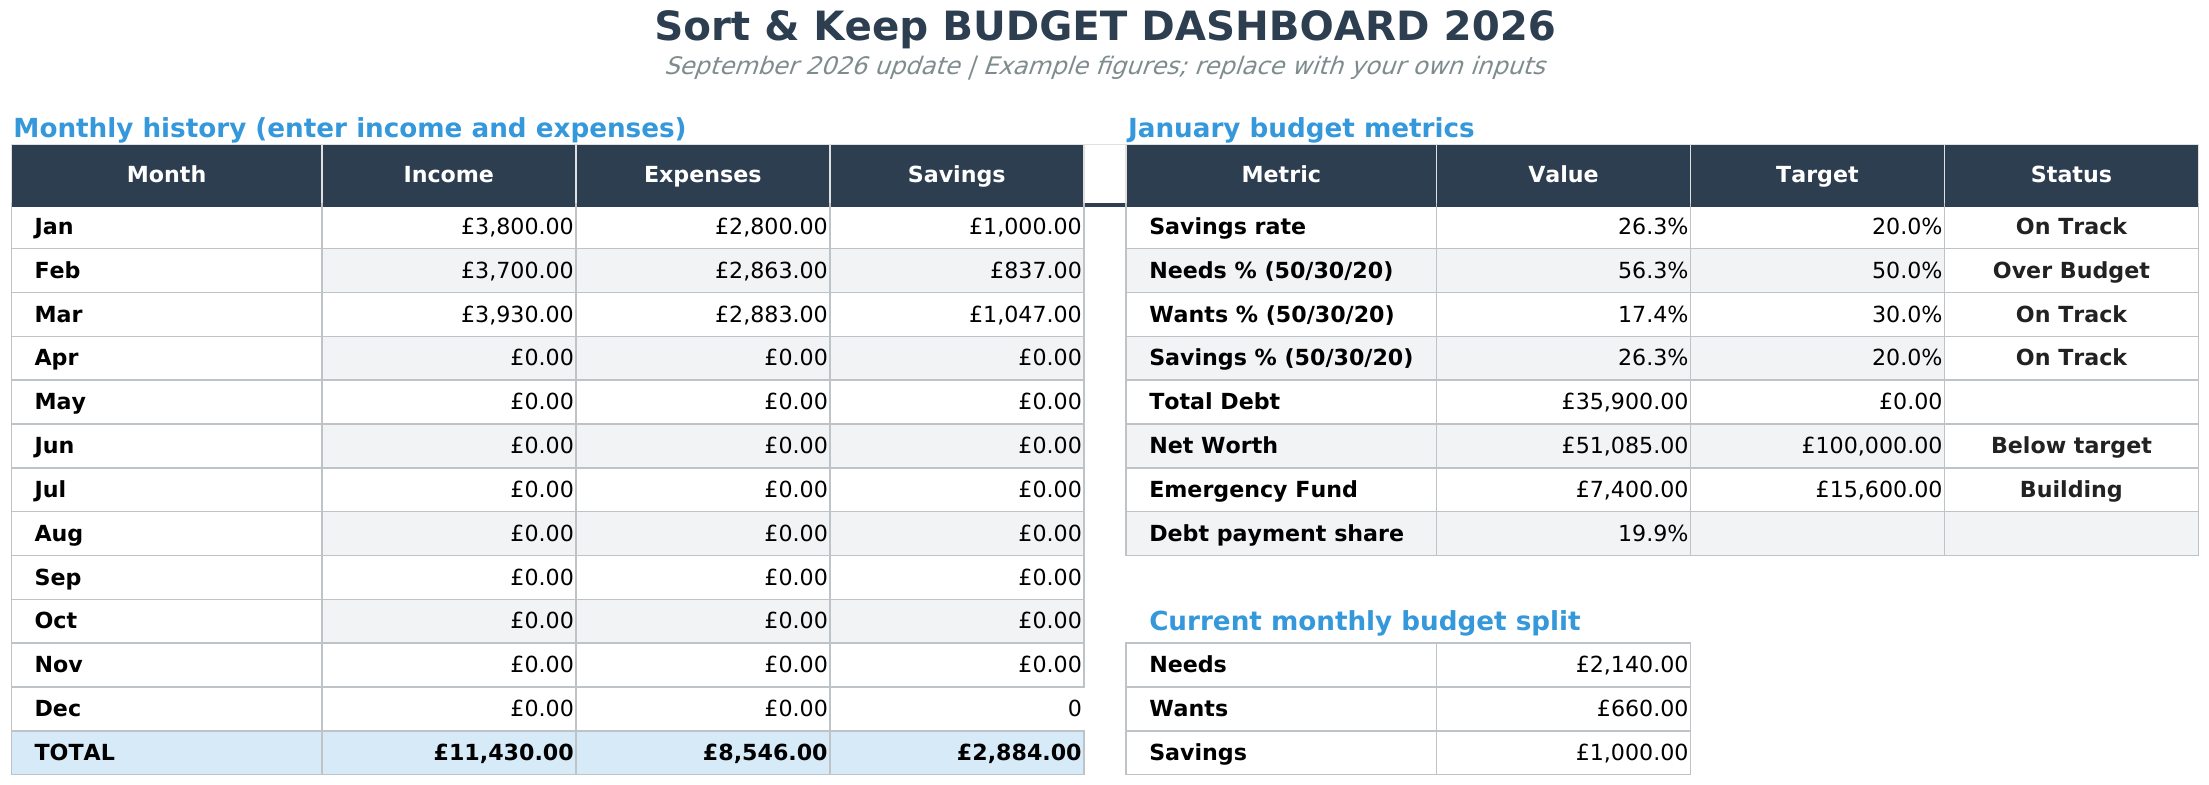
Your FIRE spreadsheet is only as good as the expense data you feed it. Track your actual spending for at least three months before trusting your projections. Our Free Budget Tracker | Also on Sort & Keep handles the categorisation and gives you a monthly total you can plug directly into your FIRE calculator. If you want budgeting, net worth tracking, and savings goals alongside your FIRE planning, the Budget Dashboard 2026 ($10.81) | Also on Sort & Keep puts everything in one Google Sheet.
UK edition built for British finances. HMRC Self Assessment categories, council tax tracking, National Insurance (Class 2 and Class 4) calculations, ISA allowances, and GBP formatting throughout. US edition included with IRS tax brackets, 401(k) tracking, and USD formatting.
If you want to cut expenses using the 50/30/20 framework, that's a proven starting point. And if you want to see how different budget approaches compare, see the related guide.
Build it, track it, and let compound interest do the boring work.
Related Reads
- How to Track Your Net Worth in Google Sheets
- Savings Goal Tracker Spreadsheet
- Budget Template for High Earners: Tax Optimisation & Lifestyle Inflation
- Budget Spreadsheet Templates 2026: Compare Free and Paid Options
Get free spreadsheet templates and updates. New templates, feature updates, and practical guides delivered to your inbox. No spam, unsubscribe anytime.
Subscribe free → | Already have a template? Download the free budget tracker or free meal planner. Email required for delivery; newsletter optional.
Choose the right next step
Need a simple budget tracker spreadsheet? Start with the Free Budget Tracker. Use Budget Dashboard 2026 when you want budgets, debt, savings and net worth in one workbook. Choose the Complete Collection when several parts of life admin need sorting.