How to Analyze a Rental Property Deal in Google Sheets (Step-by-Step)
Rental property deal analysis step by step with real numbers. Calculate cash flow, cap rate, cash-on-cash return, and DSCR. See the full breakdown.


From Sort & Keep, the maker of the linked templates. Our current product prices update with your selected currency. Worked examples and third-party prices keep their stated currency and date.
Knowing how to analyze a rental property deal is the difference between building wealth and buying yourself a second job. You found a duplex on Zillow. Two units, both rented, $250,000 asking price. The listing says "great cash flow property" and your back-of-napkin math says rent covers the mortgage. So it's a good deal, right?
Maybe. Or maybe the property taxes are about to spike after reassessment, the roof needs replacing in three years, and the "great cash flow" disappears the moment you account for vacancy, maintenance, and management fees.
New investors fall into two camps. The first group overthinks it: building 47-tab spreadsheets with Monte Carlo simulations and 10-year projections based on blog-post assumptions. The second group underthinks it. "Does rent cover mortgage?" is their entire analysis. Both lose money, just for different reasons.
There's a middle ground: eight numbers, one spreadsheet, a clear answer on whether a property is worth pursuing. We'll walk through it step by step using a real example.
Want this already built? The Rental Property Portfolio Tracker handles every formula, sensitivity table, and scenario in this guide. Get it for $40.58 on Sort & Keep →
The Eight Numbers You Need Before Making an Offer
Before you go deeper, here's the framework. Every rental property deal comes down to eight numbers:
- Gross Rental Income: what the property produces at full occupancy
- Effective Gross Income: what it actually produces after vacancy
- Operating Expenses: everything that keeps the property running (excluding mortgage)
- Net Operating Income (NOI): income minus expenses, before debt
- Cash Flow After Debt Service: what you actually pocket each month
- Cash-on-Cash Return: your annual return on the cash you invested
- Cap Rate: the property's return independent of financing
- DSCR: whether the property can comfortably cover its mortgage
Calculate all eight and you can evaluate any deal. The rest is stress-testing your assumptions.
The Example Property
We'll use this throughout:
| Detail | Value |
|---|---|
| Property | Duplex (2 units) |
| Purchase Price | $250,000 |
| Down Payment | 25% ($62,500) |
| Closing Costs | $6,250 (estimated 2.5%) |
| Loan Amount | $187,500 |
| Interest Rate | 7.25% (30-year fixed) |
| Unit A Rent | $1,350/month |
| Unit B Rent | $1,150/month |
| Property Taxes | $3,200/year |
| Insurance | $1,800/year |
This is a realistic deal in a mid-sized Midwest market in 2026. Not a home run, not a disaster. Exactly the kind of property where analysis separates "buy" from "pass."
Step 1: Gather Your Data
Open a new Google Sheet (or grab the Rental Property Portfolio Tracker if you want this pre-built with sensitivity tables included). Create an input section at the top with cells for purchase price, down payment %, closing costs, loan amount, interest rate, loan term, rent per unit, property taxes, and insurance. Use formulas to derive values: =B2*B3 for down payment dollars, =B4+B5 for total cash invested, =B2-B4 for loan amount.
Total Cash Invested: $68,750 (down payment plus closing costs). This is the denominator in your cash-on-cash calculation, and forgetting closing costs is one of the most common mistakes we see.
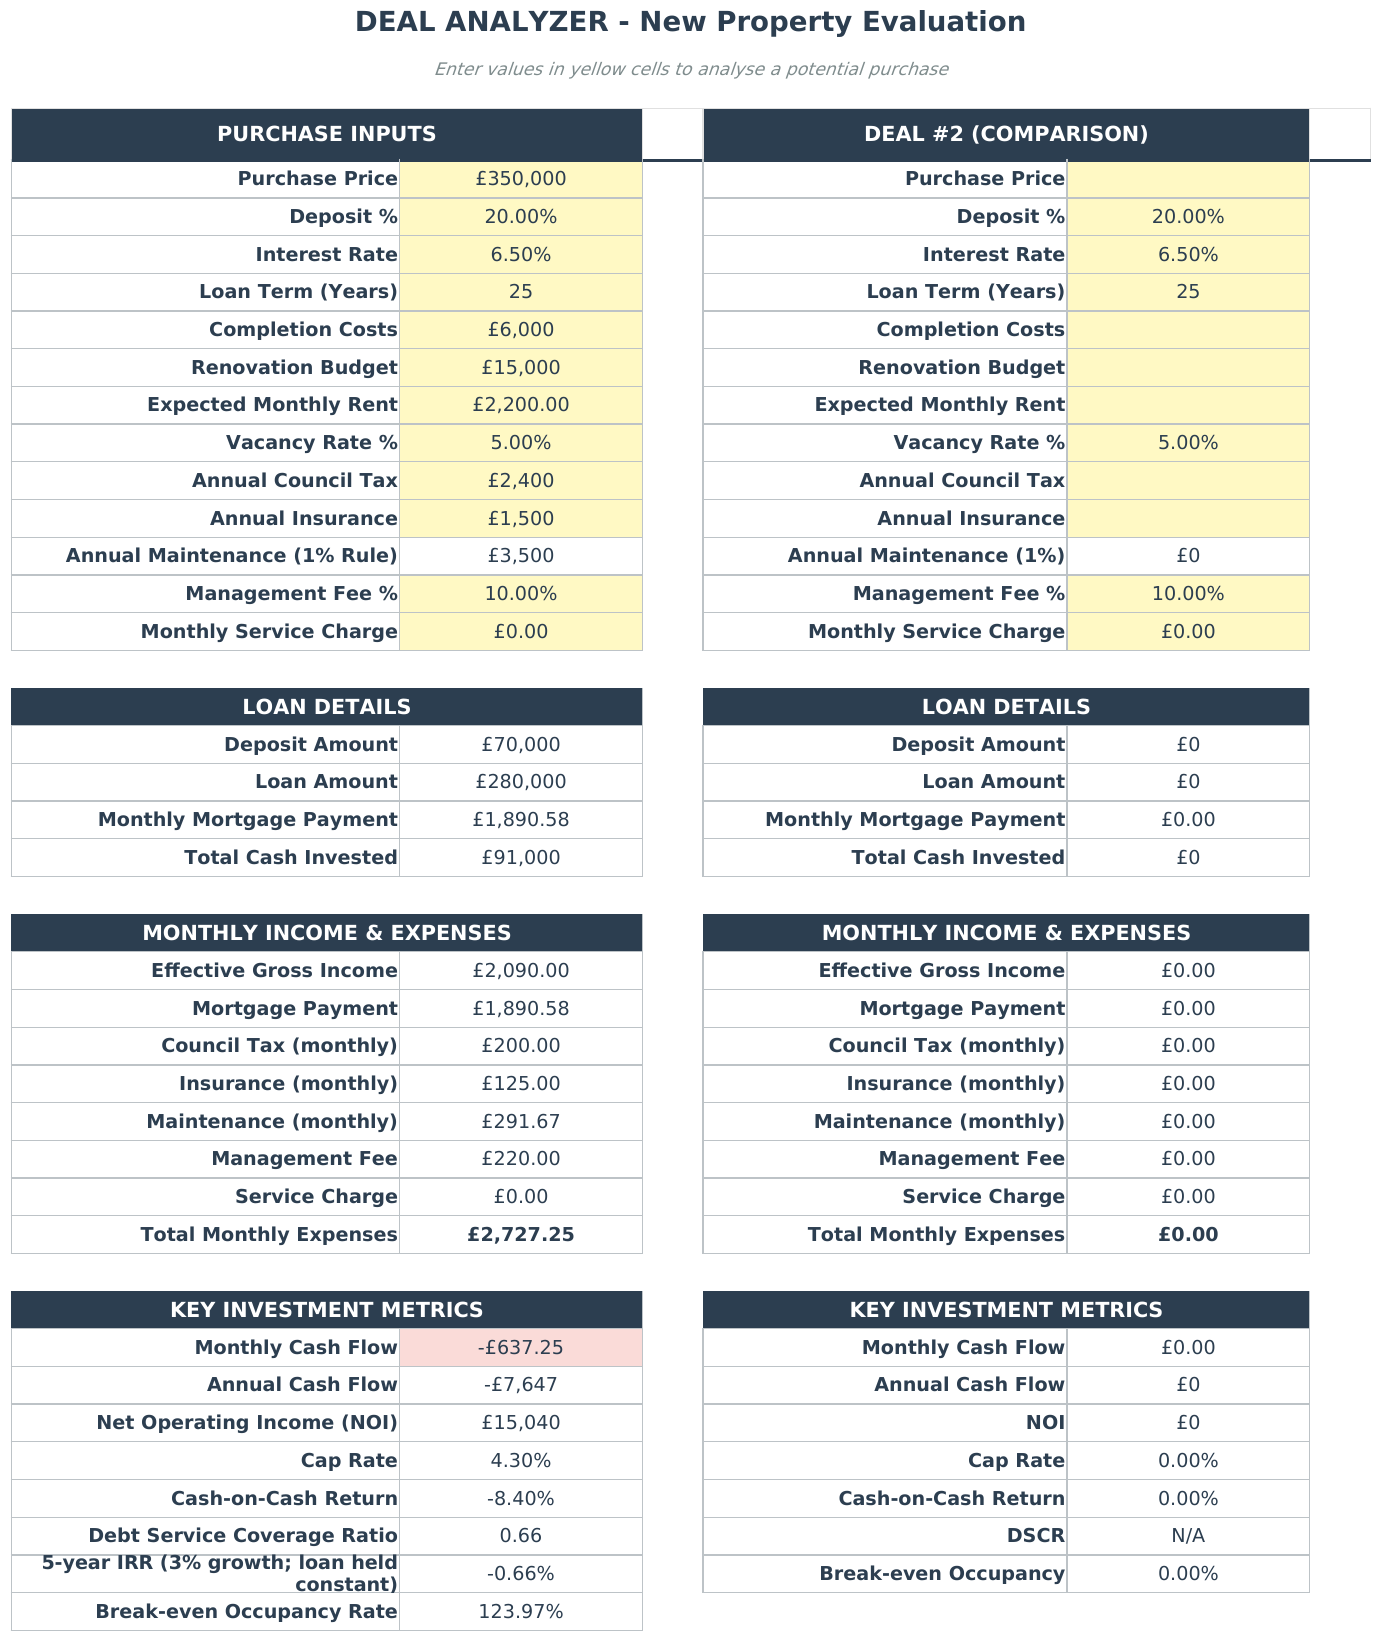
Here's what a structured input section looks like in practice. Purchase price, financing terms, and projected rents all in one view, with metrics calculated automatically below.
Your monthly mortgage payment (principal + interest) uses the PMT function:
=PMT(B8/12, B9*12, -B7)
Result: $1,279/month or $15,349/year.
Step 2: Calculate Gross and Effective Gross Income
Gross Rental Income is simple. Add up all rents assuming 100% occupancy:
= (B10 + B11) * 12
Result: $30,000/year ($2,500/month).
No property stays 100% occupied. Between tenant turnover, lease-up time, and the occasional bad month, you need a vacancy factor. Use 5% as a baseline for stable markets with low turnover, and 8-10% for higher-turnover areas or properties needing work.
For our duplex, we'll use 5%:
Vacancy Loss = $30,000 x 5% = $1,500
Effective Gross Income: $28,500/year
Step 3: Calculate Operating Expenses
Underestimated expenses can change the result. Check the following costs:
| Expense | Annual Cost | % of Gross Rent |
|---|---|---|
| Property Taxes | $3,200 | 10.7% |
| Insurance | $1,800 | 6.0% |
| Maintenance/Repairs | $2,500 | 8.3% |
| Property Management | $2,400 | 8.0% |
| CapEx Reserves | $1,500 | 5.0% |
| Utilities (landlord-paid water) | $1,200 | 4.0% |
| Total Operating Expenses | $12,600 | 42.0% |
A few notes on the less obvious lines:
Maintenance/Repairs ($2,500): Budget 1% of property value for properties in good condition. Older properties need 1.5-2%.
Property Management ($2,400): Even if you self-manage, include 8% of gross rent. Your time has value, and if your situation changes, you need to know the deal still works with a manager.
CapEx Reserves ($1,500): Separate from repairs. This covers big-ticket replacements: roof (25 years), HVAC (15 years), water heater (10 years). Set aside 5% of gross rent as a minimum.
Skip the formula-building. The Rental Property Portfolio Tracker has every operating expense category pre-wired with built-in sensitivity tables. Grab it for $40.58 →
Step 4: Calculate Net Operating Income (NOI)
NOI is income after all operating expenses but before mortgage payments. It's how the property performs regardless of financing.
NOI = Effective Gross Income - Total Operating Expenses
NOI = $28,500 - $12,600
NOI: $15,900/year ($1,325/month)
This is the most important number in deal analysis. It feeds into nearly everything else. Get NOI wrong and every downstream calculation breaks.
Step 5: Calculate Cash Flow After Debt Service
Now subtract the mortgage:
Annual Cash Flow = NOI - Annual Debt Service
Annual Cash Flow = $15,900 - $15,349
Annual Cash Flow: $551 ($46/month)
That's tight. We've already set aside reserves for maintenance and CapEx, so this $551 is what truly hits your pocket. A deal that barely cash-flows needs serious stress-testing in Step 7.
Step 6: Calculate Key Metrics
Here's where you find out whether this deal meets your investing criteria.
Cash-on-Cash Return
Cash-on-Cash = Annual Cash Flow / Total Cash Invested
Cash-on-Cash = $551 / $68,750
Cash-on-Cash Return: 0.80%
Review the assumptions behind the result and consider costs and risks separately. The example cannot establish whether a property is a suitable investment.
Cap Rate
Cap Rate = NOI / Purchase Price
Cap Rate = $15,900 / $250,000
Cap Rate: 6.36%
Not terrible for a duplex in a decent market. Cap rates vary widely: 4-5% in expensive coastal cities, 8-10% in Midwest secondary markets. It's useful for comparing properties against each other since it strips out financing. See our guide to calculating cap rate in Google Sheets for a deeper look at this metric.
Debt Service Coverage Ratio (DSCR)
DSCR = NOI / Annual Debt Service
DSCR = $15,900 / $15,349
DSCR: 1.04
Lenders typically want 1.2 or higher for investment property loans. At 1.04, the property barely covers its mortgage. If vacancy hits 8% or you get a $2,000 plumbing bill, you're dipping into personal funds.
Summary Table
| Metric | Value | Typical Minimum |
|---|---|---|
| Cash-on-Cash Return | 0.80% | 8-10% |
| Cap Rate | 6.36% | 5-8% (market-dependent) |
| DSCR | 1.04 | 1.2+ |
| Monthly Cash Flow | $46 | $100-200/unit |
Step 7: Run Sensitivity Scenarios
This is where spreadsheets earn their keep. Change one variable at a time and watch what happens.
What if vacancy is 10% instead of 5%?
Effective Gross Income = $30,000 x 90% = $27,000
NOI = $27,000 - $12,600 = $14,400
Cash Flow = $14,400 - $15,349 = -$949/year
At 10% vacancy, the property loses $949 per year. One extra month of vacancy across both units pushes this deal underwater.
What if interest rates were 1% higher (8.25%)?
New mortgage payment: $1,409/month ($16,904/year)
Cash Flow = $15,900 - $16,904 = -$1,004/year
Negative cash flow. Lock this deal at 8.25% and you're writing a check every month to own it.
What if you could raise rents by $100/unit?
Gross Rent = ($1,450 + $1,250) x 12 = $32,400
Effective Gross = $32,400 x 95% = $30,780
NOI = $30,780 - $12,600 = $18,180
Cash Flow = $18,180 - $15,349 = $2,831/year
Cash-on-Cash = $2,831 / $68,750 = 4.12%
Better, but still below the 8% threshold most investors target. You'd need rents about $250 higher per unit, or a lower purchase price, to make this deal work on cash flow alone.
A sensitivity table automates this process. Instead of running scenarios one at a time, you see every combination of vacancy and rent growth on one screen. The cells that go red are the ones that kill the deal.
What purchase price makes this work?
Work backwards. For 8% cash-on-cash, you need about $5,500 in annual cash flow. At a $210,000 purchase price (with a proportionally smaller loan), the numbers start working. That tells you your maximum offer is well below asking.
Step 8: Make the Decision
Our $250,000 duplex: cash-flows $46/month, returns 0.80% cash-on-cash, DSCR of 1.04, and goes negative with any vacancy or rate increase.
This deal doesn't work at asking price. It might work at $210,000-$215,000, or if rents are significantly below market and you can raise them immediately. But at $250,000 with 7.25% financing, you're buying yourself a second job that pays $46 a month. Not an investment. A hobby with terrible pay.
The discipline to walk away is what separates investors who build wealth from investors who collect properties and stress.
Common Red Flags That Kill Deals
Even if the numbers look good on paper, watch for these:
DSCR below 1.2. Your property should cover its mortgage with room to spare. A DSCR of 1.0-1.1 means you're one bad month away from reaching into your personal account. We won't touch anything below 1.2.
"It'll appreciate." Banking on appreciation to justify negative cash flow is speculation, not investing. Markets go sideways for years. If the deal doesn't work on today's numbers, appreciation is a hope, not a plan.
Deferred maintenance hiding in the inspection. A deal at $250,000 looks very different at $250,000 plus $15,000 in deferred maintenance. That aging roof, galvanized plumbing, undersized electrical panel: these are five-figure line items. Get the inspection before you finalize your numbers.
Below-market rents that "you can raise." Sometimes rents are below market because the landlord hasn't raised them. Sometimes the property genuinely can't command more. Verify with actual comparable listings, not Zillow estimates.
Seller-provided financials with no verification. "The property grosses $30,000 a year" means nothing without lease agreements, bank statements, and tax returns. Trust, but verify.
Why the 1% Rule and 50% Rule Are Starting Points
You'll hear these rules in every real estate forum:
The 1% Rule: Monthly rent should be at least 1% of the purchase price. Our duplex hits exactly 1.0% ($2,500 / $250,000) and barely cash-flows. The 1% rule was popularized when rates were 4-5%. At 7%+ rates, you often need 1.2% or higher.
The 50% Rule: Assume 50% of gross rent goes to operating expenses (excluding mortgage). Our duplex is at 42%, below the rule, and still barely works. The 50% rule is conservative in some markets and dangerously optimistic in others.
Both rules are useful as 5-second screening tools when scrolling through listings. If a property fails both rules badly, skip the full analysis. But if it passes, you still need to run all eight numbers. Rules of thumb don't account for your specific financing, tax rates, or property condition. For more on building a repeatable screening system, see the real estate investment spreadsheet and ROI calculator we put together.
From Analysis to Action
Screen with the 1% rule to filter listings in 10 seconds. Analyze promising properties in 20-30 minutes using all eight numbers. Stress-test finalists at 10% vacancy and 1% higher rates. The deal that still works under pressure is the one worth buying.
Keep every analysis. Save each deal as a separate tab. After 20-30 analyses, you develop an intuition for your market that no course can give you.
After purchase, a per-property P&L like this one tracks whether the deal is actually performing the way your analysis predicted. Month by month, with annual totals.
If you want a pre-built version of this framework, the Rental Property Portfolio Tracker includes a full deal analyzer alongside portfolio management, tenant tracking, and tax worksheets. One spreadsheet for the entire lifecycle. It covers both UK buy-to-let (council tax bands, EPC ratings, Gas Safety Certificate tracking, leasehold vs freehold analysis, HMRC Self Assessment categories) and US investors (Schedule E, 1031 exchange planning, 27.5-year depreciation schedules).
But whether you build your own or use ours, run the numbers. Every time. On every deal. The spreadsheet doesn't lie, even when the listing does.
Ready to stop building this from scratch? Get the Rental Property Portfolio Tracker for $40.58 on Sort & Keep →
Related Reads
- Rental Property Portfolio Tracker: Analyze Deals, Manage Tenants, Track ROI
- Real Estate Investment Spreadsheet: ROI Calculator and Deal Analyzer
- How to Calculate Cap Rate in Google Sheets
Get free spreadsheet templates and updates. New templates, feature updates, and practical guides delivered to your inbox. No spam, unsubscribe anytime.
Subscribe free → | Already have a template? Download the free budget tracker or free meal planner. Email required for delivery; newsletter optional.
Looking for more options? Browse our complete guide to rental property spreadsheets.
Choose the right next step
Use the Freelance Command Center for a freelance income and invoice tracker spreadsheet. Use the Rental Property Portfolio Tracker for rent, expense, deal and ROI tracking. The Business Essentials Bundle combines both workbooks.