Real Estate Investment Spreadsheet: ROI Calculator for Landlords
Real estate investment spreadsheets compared: 6 ROI calculators tested for buy-and-hold rental properties. See the full breakdown.


From Sort & Keep, the maker of the linked templates. Our current product prices update with your selected currency. Worked examples and third-party prices keep their stated currency and date.
You ran the numbers on a rental property and the deal looked solid. 8% cash-on-cash return. Positive cash flow from month one. You bought it. Six months later, you're barely breaking even and you can't figure out where the math went wrong.
We've been there. The problem wasn't the property. It was the spreadsheet.
A half-built Google Sheet with hard-coded assumptions will make almost any deal look good. It's the things you forget to model that destroy returns: vacancy you assumed wouldn't happen, maintenance that runs triple your estimate, property management fees you planned to avoid but couldn't, and CapEx you never budgeted for.
A proper real estate investment spreadsheet stress-tests the deal, exposes the weak points, and gives you a number you can trust before you wire six figures to escrow.
Get the Rental Property Portfolio Tracker on Sort & Keep → All five core metrics, sensitivity analysis, and portfolio dashboard for a one-time £29.79.
Why Spreadsheets Beat SaaS for Real Estate Analysis
Before we get into specific tools, here's why we still recommend spreadsheets over dedicated real estate SaaS platforms for most buy-and-hold investors:
You own your data. Your deal analysis and projections live in a file you control. No company can sunset your account, change pricing, or lock your data behind a paywall. We've watched three real estate analysis platforms shut down or get acquired in the last two years. Every user started over.
You can customize the formulas. Every market is different. A spreadsheet lets you add columns for your tax situation, adjust depreciation schedules, or model a house-hack scenario no generic tool anticipates.
No monthly fees compounding against your returns. A $49/month SaaS tool costs $588/year. Over a 10-year hold, that's $5,880. A one-time spreadsheet purchase is a one-time cost.
Works offline and has no vendor lock-in. Run numbers in the car at a showing. Export your data whenever you want. Share a copy with your CPA or lender without giving anyone a login.
The 5 Metrics Every Real Estate Investment Spreadsheet Must Calculate
If your spreadsheet doesn't calculate all five of these, it's a toy, not a tool. Here's what each one means and why it matters, with concrete numbers.
1. Cash-on-Cash Return (CoC)
What it is: Annual pre-tax cash flow divided by the total cash you invested.
Example: You buy a rental for $250,000 with 25% down ($62,500) plus $7,500 in closing costs. Total cash invested: $70,000. The property generates $6,300/year in cash flow after all expenses and debt service. Your cash-on-cash return is $6,300 / $70,000 = 9.0%.
Why it matters: This is the metric that tells you what your actual dollars are earning. A property can appreciate beautifully and still produce a terrible cash-on-cash return if you overpaid or the expenses are too high. Most buy-and-hold investors target 8-12%.
2. Cap Rate (Capitalization Rate)
What it is: Net operating income (NOI) divided by property value. NOI is gross income minus operating expenses, before debt service.
Example: Same property. Gross rental income of $24,000/year. Operating expenses (taxes, insurance, maintenance, vacancy, management) total $9,600. NOI = $14,400. Cap rate = $14,400 / $250,000 = 5.76%.
Why it matters: Cap rate strips out financing, so you can compare properties regardless of how they're funded. A 4% cap rate in San Francisco vs a 9% cap rate in Memphis tells you something about risk, growth expectations, and market dynamics.
3. DSCR (Debt Service Coverage Ratio)
What it is: NOI divided by annual debt service (total mortgage payments for the year).
Example: NOI of $14,400. Annual mortgage payments of $12,048 (a $187,500 loan at 7% over 30 years). DSCR = $14,400 / $12,048 = 1.20.
Why it matters: Below 1.0 means the property can't cover its own mortgage from rental income. Most DSCR lenders require 1.20-1.25 minimum. Even with conventional financing, DSCR tells you how much cushion you have before vacancy or expense spikes push you underwater.
4. IRR (Internal Rate of Return)
What it is: The discount rate that makes the net present value of all future cash flows (including the eventual sale) equal to zero. In plain English: the annualized total return accounting for the time value of money.
Example: You invest $70,000, collect cash flow for 7 years, and sell for $310,000 (after 3% annual appreciation minus selling costs). Your IRR might be 14.2%. That accounts for cash flow, principal paydown, appreciation, and the time value of every dollar.
Why it matters: IRR gives you an apples-to-apples comparison between real estate and other investments. An 8% CoC looks good until you realize the same $70,000 in an index fund returned 11% annualized. IRR accounts for cash flow timing, which simple return percentages ignore.
5. Gross Rent Multiplier (GRM)
What it is: Property price divided by annual gross rental income.
Example: $250,000 purchase price / $24,000 annual gross rent = 10.4 GRM.
Why it matters: The quickest screening metric. Five seconds to calculate, tells you immediately whether a property is worth deeper analysis. GRM under 12-15 signals potential. Above 20, the numbers rarely work for cash flow investors. Not a decision metric. A filter.
Want to see all five of these calculated automatically, side-by-side, for every property in your portfolio? That's exactly what the Rental Property Portfolio Tracker does. Grab it for $40.58 on Sort & Keep →
6 Real Estate Investment Spreadsheets Compared
Here's how they performed.
1. Free Google Sheets Templates (BiggerPockets Community, Reddit, YouTube)
Platform: Google Sheets
Price: Free
Best for: First-time investors analyzing their first 1-3 deals
Dozens of free real estate investment spreadsheet templates are floating around from BiggerPockets forum members, Reddit's r/realestateinvesting, and YouTube creators.
Pros:
- Free, simple enough to understand in 10 minutes
- Easy to duplicate and modify
- Some include decent instructional notes
Cons:
- Most only calculate 1-2 metrics (usually CoC and maybe cap rate)
- Vacancy and CapEx assumptions often hard-coded at unrealistic numbers (3% vacancy, 5% maintenance)
- No sensitivity analysis. One scenario, take it or leave it
- Formulas occasionally have errors nobody audits
Verdict: Fine for learning the basics. Dangerous for buying decisions.
2. BiggerPockets Investment Calculators
Platform: Web app (browser-based)
Price: $39.99/year (included with Pro membership)
Best for: Investors who want quick, structured analysis without building anything
BiggerPockets offers four calculators (rental, BRRRR, flip, wholesale). The rental calculator is most relevant for buy-and-hold.
Pros:
- Guided input flow. Hard to accidentally skip an expense category
- Calculates CoC, cap rate, and basic ROI with printable PDF reports
- Includes 50% rule and 2% rule quick checks
Cons:
- Web-only. No offline access, no file you own
- $39.99/year recurring; cancel and you lose saved analyses
- No IRR, no sensitivity analysis, no portfolio comparison
- Can't customize formulas
Verdict: Solid training wheels. The guided flow prevents beginners from forgetting expense categories. But for serious investors analyzing multiple deals per month, the lack of customization and portfolio comparison is limiting. Recurring fees for a calculator feel wrong when a spreadsheet does more for a one-time cost.
3. DealCheck App
Platform: iOS, Android, Web
Price: Free (3 deals) / $12.50/month or $99/year (unlimited)
Best for: Investors who want a polished mobile app for quick analysis on the go
The most popular dedicated real estate analysis app, handling rentals, BRRRRs, flips, and multi-family.
Pros:
- Slick mobile interface. Run numbers at a property showing
- MLS and public record data import for faster setup
- Calculates CoC, cap rate, and cash flow projections with shareable PDF reports
Cons:
- $99/year for the full version
- No true IRR calculation (their "annualized return" is simplified)
- Limited sensitivity analysis; no portfolio comparison
- Data lives in their cloud. No export to spreadsheet format
- Three-deal limit on free tier; you'll hit it your first weekend
Verdict: Best mobile experience for quick screening. But the recurring cost and lack of data portability make it a complement to a spreadsheet, not a replacement. Use DealCheck for a first pass at a showing, then run the real numbers in your own spreadsheet.
4. Paid Excel/Google Sheets Templates (Etsy and Gumroad)
Platform: Excel and/or Google Sheets
Price: $15-$45 (one-time)
Best for: Investors who want more rigor than free templates without building from scratch
We bought and tested six of the top sellers across Etsy and Gumroad. Quality varies wildly.
Pros:
- One-time cost, no recurring fees
- The best ones calculate all five core metrics including IRR
- You own the file and can customize it
Cons:
- Quality is extremely inconsistent.
- Most don't include sensitivity analysis
- Documentation is often a single-page PDF that doesn't explain assumptions
- No updates or support after purchase; most Etsy sellers don't respond to questions
- Some lock formulas behind sheet protection with no password provided
Verdict: Buyer beware. The best paid templates are genuinely good. Clean formulas, proper IRR, reasonable assumptions. The worst are free templates with a coat of paint and a $30 price tag. Look for sellers who specifically mention IRR and sensitivity analysis. If you want to understand what separates a good analysis from a bad one first, read our guide on how to analyze a rental property deal.
5. Custom-Built Spreadsheets (DIY)
Platform: Excel or Google Sheets
Price: Free (your time)
Best for: Experienced investors with spreadsheet skills who want total control
Maximum flexibility if you know what you're doing.
Pros:
- Complete customization. Every formula exactly how you want it
- No cost beyond your time
- Can evolve with your strategy
Cons:
- A proper spreadsheet with all five metrics and sensitivity analysis takes 20-40 hours to build and debug
- High error risk. Your mistakes compound silently with no external validation
- Not practical for most investors; your time has a dollar value
Verdict: Great learning exercise. But using a self-built spreadsheet for six-figure buying decisions is a different calculation. Most investors' time is better spent analyzing more deals.
6. Sort & Keep Rental Property Portfolio Tracker
Platform: Google Sheets (also works in Excel)
Price: £29.79 one-time
Best for: Buy-and-hold investors managing 1-20 properties who want analysis and ongoing tracking in one tool
We built this because we couldn't find a real estate investment spreadsheet that handled both pre-purchase analysis and post-purchase portfolio management without breaking at scale.
Pros:
- All five core metrics: CoC, cap rate, DSCR, IRR, and GRM
- Sensitivity analysis for rent growth, vacancy, and interest rates
- Portfolio dashboard comparing up to 20 properties side-by-side
- Refinance modeling, tenant tracking, mortgage amortization
- Tax worksheet mapped to Schedule E with depreciation tracking
- 1031 exchange timeline and basis tracking
- One-time £29.79. All formulas visible and unlocked
Cons:
- No automatic MLS data import (manual entry)
- Google Sheets can feel slow on very large portfolios (15+ properties with years of data)
- Newer product with a growing (not massive) community
Verdict: Our tool, so take this with appropriate skepticism. But it's the only option we found that bridges deal analysis and portfolio management in one spreadsheet, calculates all five core metrics including true IRR, and includes sensitivity analysis. All for a one-time price. Get the Rental Property Portfolio Tracker on Sort & Keep. See our full Rental Property Portfolio Tracker review for a deeper walkthrough.
UK edition built for buy-to-let landlords. Council tax bands, EPC ratings, Gas Safety Certificate tracking, leasehold vs freehold analysis, and HMRC Self Assessment categories. US edition included with Schedule E, 1031 exchange planning, and 27.5-year depreciation schedules. Deciding between buy-to-let and flipping? Check out our buy-to-let vs flip spreadsheet comparison.
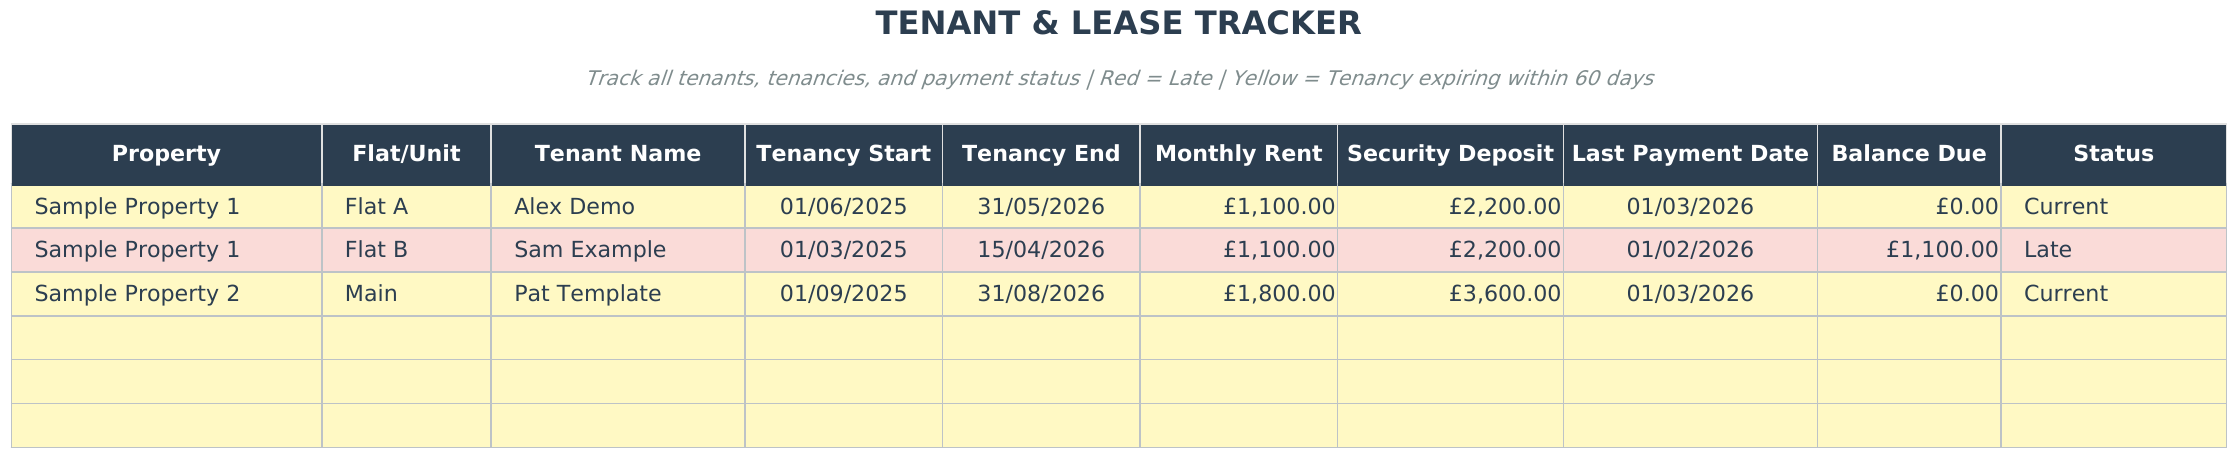
The deal analyzer lets you enter purchase price, down payment, loan terms, and projected expenses. Then calculates all five core metrics automatically for side-by-side comparison.
Quick Comparison
| Tool | Price | CoC | Cap Rate | DSCR | IRR | Sensitivity | Portfolio View |
|---|---|---|---|---|---|---|---|
| Free Google Sheets | Free | Yes | Sometimes | Rarely | No | No | No |
| BiggerPockets Calc | $39.99/yr | Yes | Yes | No | No | No | No |
| DealCheck | $99/yr | Yes | Yes | Partial | No | Limited | No |
| Paid Etsy/Gumroad | $15-45 | Yes | Yes | Sometimes | Sometimes | Rarely | Sometimes |
| Custom DIY | Free (time) | Depends | Depends | Depends | Depends | Depends | Depends |
| Sort & Keep Tracker | £29.79 | Yes | Yes | Yes | Yes | Yes | Yes |
Advanced Features That Separate Good From Great
Here's what elevates a real estate investment spreadsheet from adequate to genuinely useful.
Sensitivity analysis is the most important advanced feature. Your projections are educated guesses. Sensitivity analysis answers: how wrong can my assumptions be before this deal stops working? A great sensitivity table shows the exact vacancy rate where cash flow goes negative, or the rent decline that drops DSCR below 1.0.
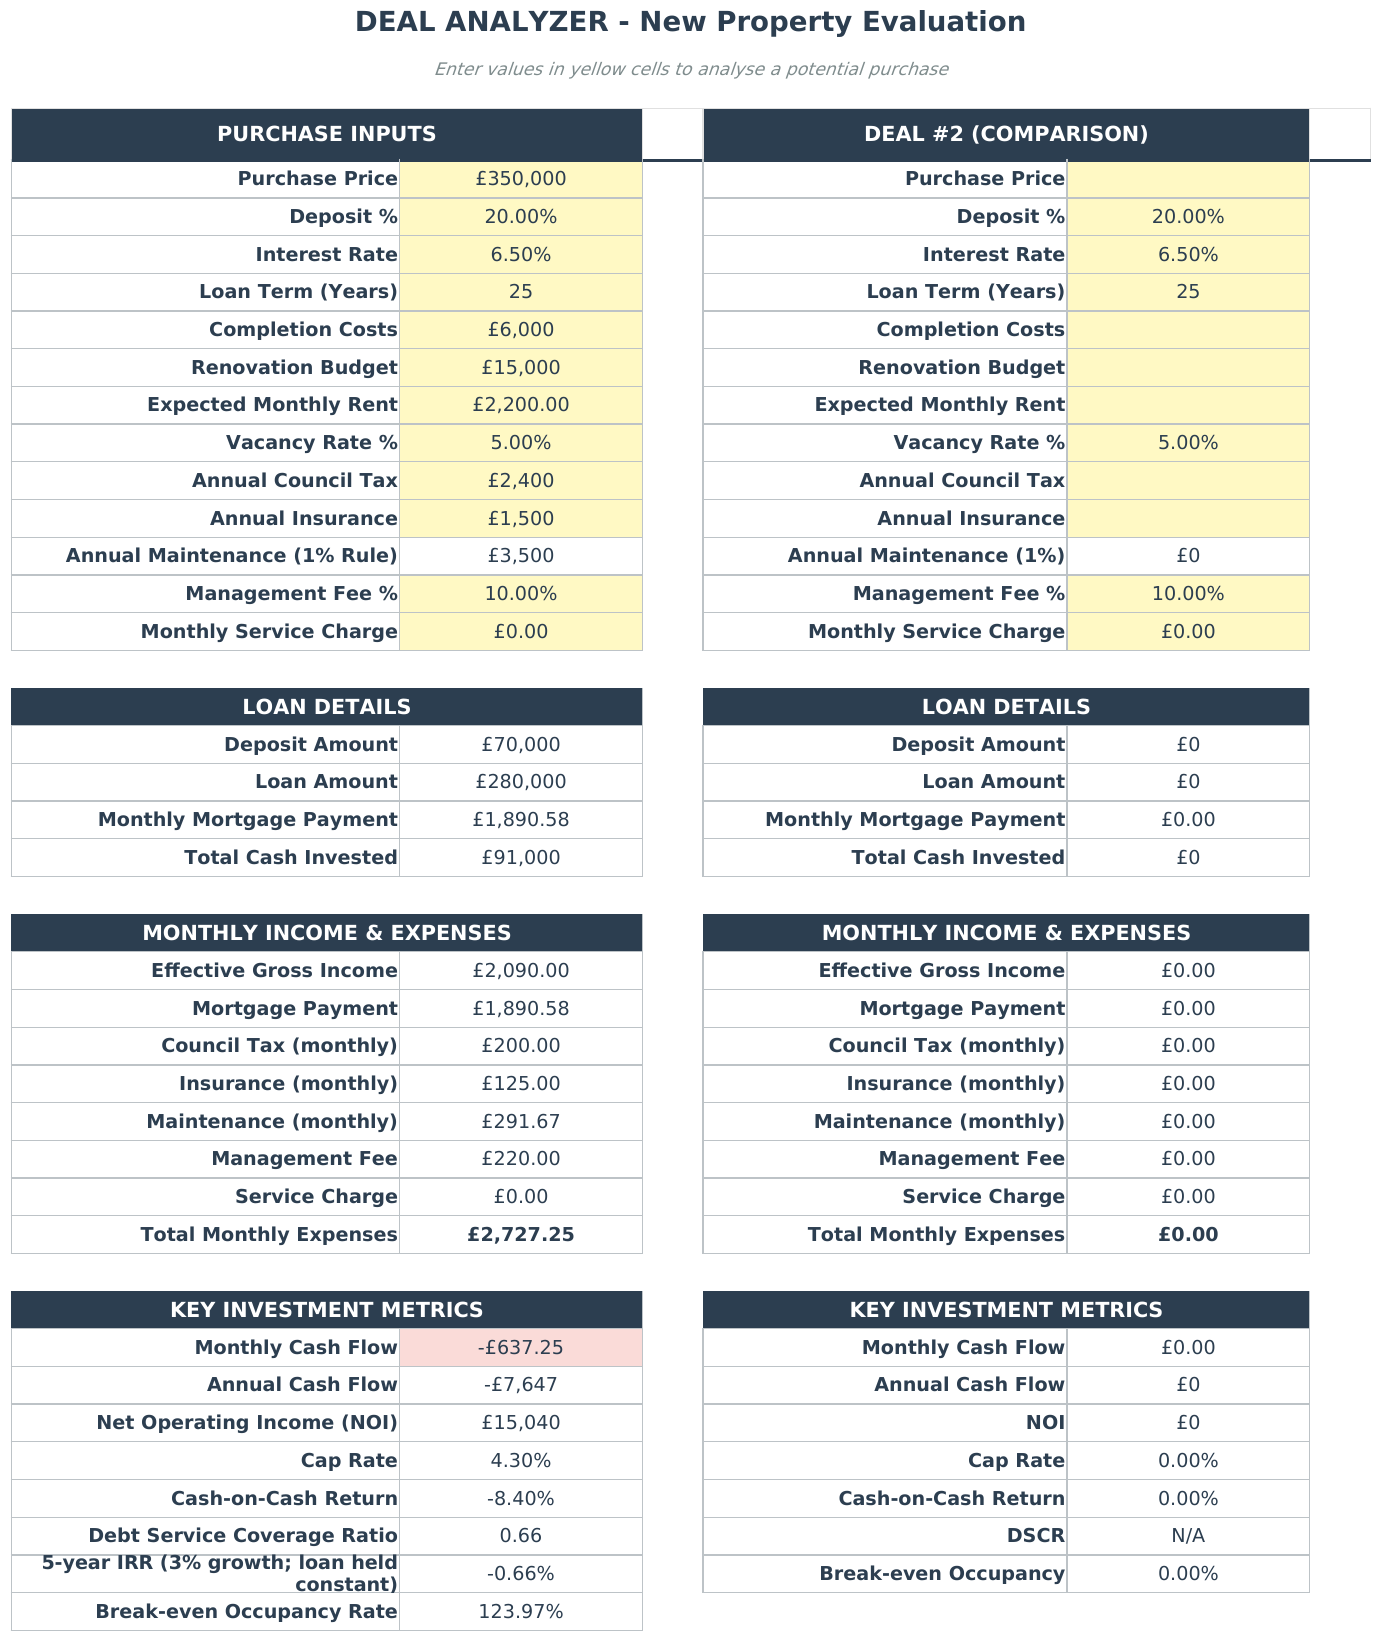
A sensitivity table like this one lets you see exactly where a deal breaks. Adjust vacancy, rent growth, or interest rates and watch the impact on cash flow and DSCR in real time.
Refinance modeling lets you input new loan terms and instantly see: Does the payment change? What are closing costs? How many months until the refi pays for itself? What happens to CoC and DSCR afterward?
1031 exchange tracking prevents costly mistakes on tax-deferred property swaps. You need to track strict timelines (45 days to identify, 180 days to close) and correctly calculate your replacement property's basis.
Portfolio-level comparison shows all properties side by side: which has the highest CoC, which has a deteriorating DSCR, which one's maintenance is eating returns. This is how you decide where to allocate your next dollar. Or which property to sell.
A portfolio dashboard puts every property on one screen. Spot the underperformers immediately instead of flipping between tabs.
Common Mistakes in Real Estate Spreadsheets (And How to Avoid Them)
These are the errors we see in almost every beginner spreadsheet and in too many paid templates. Get these wrong and your projected 10% return becomes an actual 4%.
Forgetting Vacancy (or Using an Unrealistic Rate)
A 0% vacancy assumption is fantasy. Even in tight markets, turnover means lost rent plus make-ready costs. Use 5-8% for single-family in strong markets, 8-12% for multi-family or weaker markets. If actual vacancy runs 3%, you'll outperform projections. That's better than the reverse.
Underestimating Maintenance
The "1% rule" (budget 1% of property value annually) works for newer properties. For older properties, budget 1.5-2%. Over 30 years old with original mechanicals? Budget 2-3%. We tracked actual costs across 12 properties over three years: the average was 1.4%, ranging from 0.6% (a 5-year-old townhome) to 3.1% (a 1970s duplex needing a roof and HVAC the same year).
Ignoring CapEx Reserves
Maintenance is the $200 plumber call. CapEx is the $8,000 roof, the $6,000 HVAC, the $4,000 water heater. They don't happen every year, but when they do, they wipe out multiple years of cash flow. Budget $100-$200/month per unit for CapEx reserves. This must exist in your cash flow projection or your return is overstated.
Not Accounting for Property Management Fees
"I'll manage it myself" is a plan, not a permanent condition. Always model with management fees included (8-10% of collected rent, plus a 50-100% leasing fee for new tenants). If you self-manage, that's upside against projections. If you don't model it and later need a manager, returns crater without warning.
Using Purchase Price Instead of Total Cash Invested
Your return is based on every dollar you put in: down payment, closing costs, inspection fees, immediate repairs, and capital improvements before the first tenant. Forgetting a $12,000 kitchen renovation inflates your CoC return significantly. Count every dollar that left your bank account.
Assuming Flat Expenses With Rising Rents
Projecting 3% annual rent increases with 0% expense growth is the most seductive mistake. Taxes, insurance, and maintenance all follow inflation. Model expense growth at 2-3% annually or your year-5 projections will be fiction.
The Bottom Line
Here's how to pick the right real estate investment spreadsheet for your situation:
- "I'm analyzing my first deal." Start with a free Google Sheets template. Use it to learn, not to make buying decisions.
- "I want quick screening on my phone." DealCheck's free tier for filtering, then a spreadsheet for real analysis.
- "I'm buying 1-3 properties." A paid Etsy/Gumroad template ($20-40) works if it calculates IRR with realistic assumptions.
- "I own multiple rentals and need analysis + portfolio tracking." The Sort & Keep Rental Property Portfolio Tracker. Deal analysis, portfolio management, tax prep, and sensitivity analysis in one spreadsheet for £29.79.
- "I have specific needs and strong spreadsheet skills." Build your own. Budget 20-40 hours and have someone audit your formulas.
Whatever you choose, make sure it calculates all five core metrics, models realistic vacancy and expense assumptions, and includes sensitivity analysis. A real estate deal is a six-figure bet. The tool you use to evaluate it shouldn't be the weakest link in your process.
Get the Rental Property Portfolio Tracker for $40.58 on Sort & Keep → One-time purchase. All formulas unlocked. Works in Google Sheets and Excel.
Related Reads
- Rental Property Portfolio Tracker: Analyze Deals, Manage Tenants, Track ROI
- Budget Spreadsheet Templates 2026: Compare Free and Paid Options
- Debt Payoff Calculator: Snowball vs Avalanche Method
Get free spreadsheet templates and updates. New templates, feature updates, and practical guides delivered to your inbox. No spam, unsubscribe anytime.
Subscribe free → | Already have a template? Download the free budget tracker or free meal planner. Email required for delivery; newsletter optional.
Looking for more options? Browse our complete guide to rental property spreadsheets.
Choose the right next step
Use the Freelance Command Center for a freelance income and invoice tracker spreadsheet. Use the Rental Property Portfolio Tracker for rent, expense, deal and ROI tracking. The Business Essentials Bundle combines both workbooks.